Evaluate your software code by measuring its architecture entropy
We all agree that a well-designed architecture enforce the global clarity of a software and thus increase its maintainability and scalability. For any feature added, the software architecture helps the developer to write their code and the right place.
Something frustrating when designing and implementing a software architecture is that it’s very difficult to measure the benefits brought by the architecture. Sure, we can have a feeling of improvements, but it stays a feeling difficult to rationalize.
This article tend to solve this issue by putting numbers on the architecture quality. We will see how to measure the complexity of a software by analysing its dependency graph.
Dependency graph
Entropy, applied to software describe the measure of disorder or randomness in the software. Over time, as software is modified, its entropy can increase. This refers to the degradation of code quality and system structure, making the software harder to maintain, understand, and extend. In the context of a dependency graph, an increase in entropy might be the result of unprecise dependency management, which complicates the architecture unnecessarily. But not only. Working with the dependency graph allows us to measure other various metrics.
The dependency graph of a software is composed on components and their dependencies. Components are the nodes and dependencies are directional edges linking those nodes.
Examples of bad architecture
What we want to fight when analysing the dependency graph, is the poorly designed software. In other word, the bad architectures.
Defining the quality of an architecture depends on multiple factor: the team maturity, the complexity of the product, the previous state of the architecture, etc. Choosing the right architecture requires to take all of those criteria into consideration.
What can be done is to try to detect some well-known issues in software design.
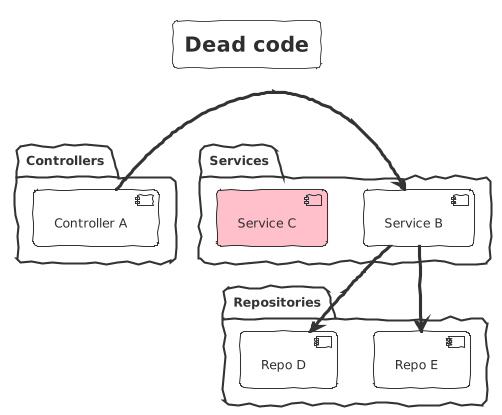
Dead code
The dead codes are the components that are no longer used. Those components are lying around somewhere waiting for someone to notice them. Even when noticed, developers may be reluctant to remove it “in case someone will need it” or “in case it’s actually used without knowing it”. It’s easy to detect and most of the modern IDE have visual effects to highlight them.
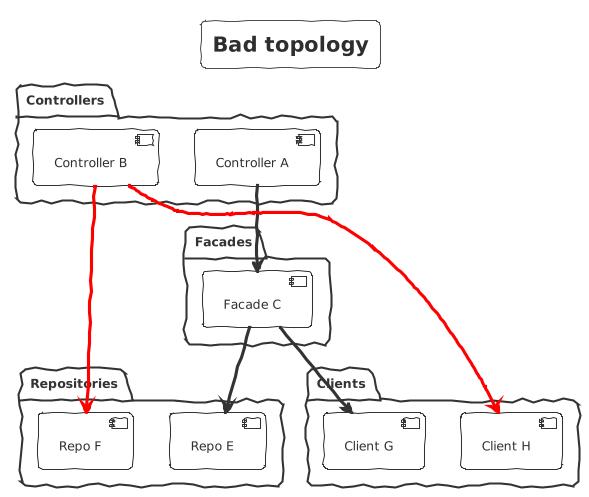
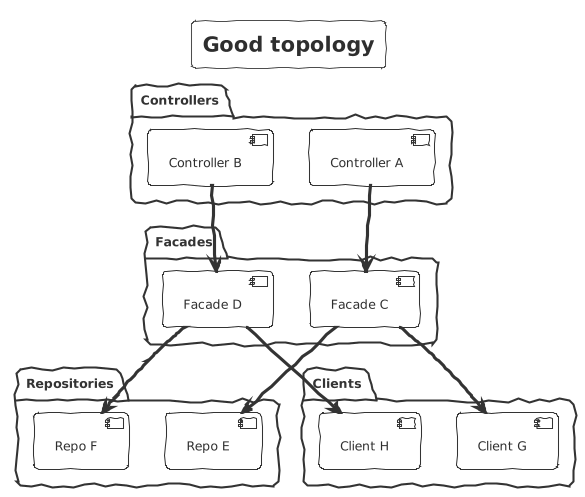
Topology and layer separations
When a component has a well-defined role, it easily finds its place to the overall software design. Components of a given role should always interact with another role the same way. This is also known as the topology of the system architecture. This is comparable to some kind of hierarchy.
Example: when introducing facades in your software, you define all sort of rules specifying how to work with them. Controllers depends on facades and facades depends on repositories and clients. The role of the facade is to orchestrate some logic.
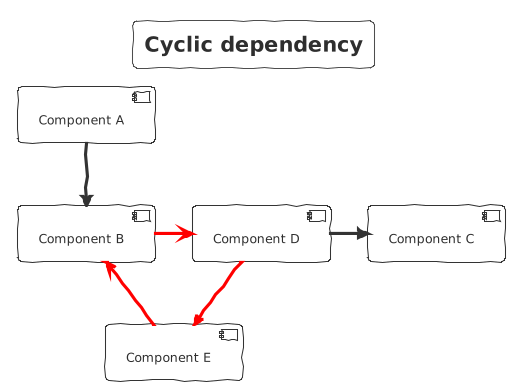
Cycling dependency
This architecture-smell is a symptom of the previous section. Components with unclear roles can lead to cyclic dependencies. Cyclic dependencies occur when a developer loses track of the dependency flow and builds up on top of everything. The result can quickly evolve toward spaghetti code.
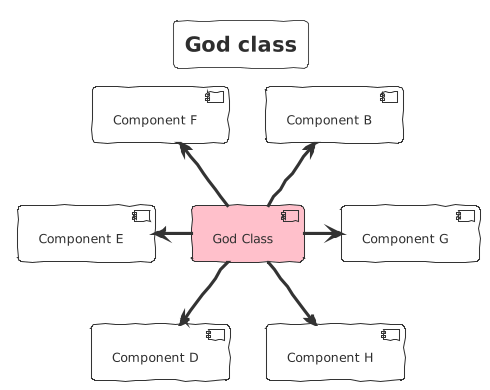
God class
The God class does everything. this is the central component of the software. It is overly large and complex, taking on too many responsibilities. This class knows too much about the system, handles multiple concerns, and is difficult to maintain.
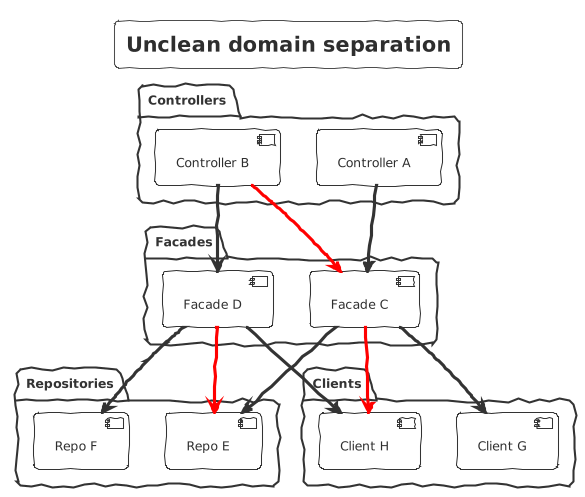
Unclear domain separation
With unclear domain separation, the risk is to multiply the interdependencies between components. You end up with multiple domains highly coupled, making it difficult to maintain and evolve.
Interesting metrics
Here are some interesting metrics that can be measured by analysing the dependency graph:
Number of cycles
| Name | Number of cycles |
|---|---|
| Description | Counts the number of circular dependencies. |
| Type | Integer from 0 |
| Interpretation | The higher the number, the less ordered the architecture is. |
Flow hierarchy
| Name | Flow hierarchy |
|---|---|
| Description | The fraction of edges not participating in cycles in a directed graph. |
| Type | Decimal from 0 to 1 |
| Interpretation | The higher the decimal, the fewer components are implied in a cycle. |
Graph density
| Name | Graph density |
|---|---|
| Description | The ratio of the number of edges in the graph to the number of edges in a complete graph with the same number of nodes. |
| Type | Decimal from 0 to 1 |
| Interpretation | An increasing graph density suggest that the components coupling is increasing. A decreasing graph density suggest that the components coupling is decreasing. |
Component in-degree
| Name | Component in-degree |
|---|---|
| Description | The in-degree of a first component measures the number of components that depend on this first component. |
| Type | Integer from 0 |
| Interpretation | A too high in-degree suggest that the component could be split into smaller components. |
Component out-degree
| Name | Component out-degree |
|---|---|
| Description | The out-degree of a first component measures the number of components that this first component depends on. |
| Type | Integer from 0 |
| Interpretation | A too high out-degree suggest that the component has too many different dependencies and could be split into smaller components. |
Component centrality-degree
| Name | Component centrality-degree |
|---|---|
| Description | The centrality-degree of a component is the addition of its in-degree and its out-degree. |
| Type | Integer from 0 |
| Interpretation | A too high centrality-degree suggest that the component is too much involved in the architecture and could be split into smaller components. |
General remark: in-degree, out-degree and centrality-degree are interesting metrics to highlight the components that needs further analysis. Depending on the component role, having a high value for one of those metrics doesn’t necessarily mean that the component is badly designed. It could also mean that the component is a transversal piece of the architecture.
Chaos Meter tool

To help you analyse your dependency graph, you can use my tool Chaos Meter. This tool analyse dependency graphs using metrics like the ones detailed above. It’s currently able to analyse graph from Node and Java projects.
You will find more info on the usage in the GitHub repository. Feel free to contribute.
Analysis on existing repositories
I could not wrap up this article without sharing some of those metrics computed on known projects.
Special mention to cBioPortal, an open source tool whose primary goal is to make complex cancer genomic data accessible and interpretable for cancer biologists and clinicians.
| Project | Type | # Cycle | Max out-degree | Density | # Layer |
|---|---|---|---|---|---|
| spring-core 6.1.2 | Java | 0 | 27 | 0.0031532186991222603 | 7 |
| spring-petclinic 3.5.0 | Java | 0 | <=3 | 0.1111111111111111 | 3 |
| cBioPortal frontend 6.3.1 | Node | 20419 | 31 | 0.002182107387753465 | N/A (due to cyclic dependencies) |
| cBioPortal 6.3.2 | Java | 1 | 68 | 0.0043742197253433205 | 9 (ignoring the cyclic dependency) |
| Lazimo frontend 845a0a1 | Node | 0 | 39 | 0.008670353727387947 | 14 |
Remember: taken alone, those numbers mean nothing and are barely comparable between projects. What matters is the evolution of those metrics in a same project.
Metric evolution
Let’s focus on the density of the project cBioPortal frontend. Going back in time, up to the version 4.0.0, we observe this evolution:
// graph
Further readings
If you are looking for an architecture that help resolve most of the bad architecture example stated above, here are some suggested readings:
- Make your microservices tastier by using the Onion architecture: The hexagonal architecture implemented in Spring Boot;
- Applying the Onion Architecture to Angular Projects: The very same onion/hexagonal architecture pattern but applied to Angular;
- A simple and clean architecture for your Angular projects: A lighter architecture for Angular.
Conclusion
Whether you start from scratch or take over an existing project, it’s always wise to keep track of the current health of your software architecture. When measured over time, this will help you identify the deviations to take actions.
print(“Keep coding and rock on!”)